
Supplier Dashboards and KPIs
Supplier Dashboard
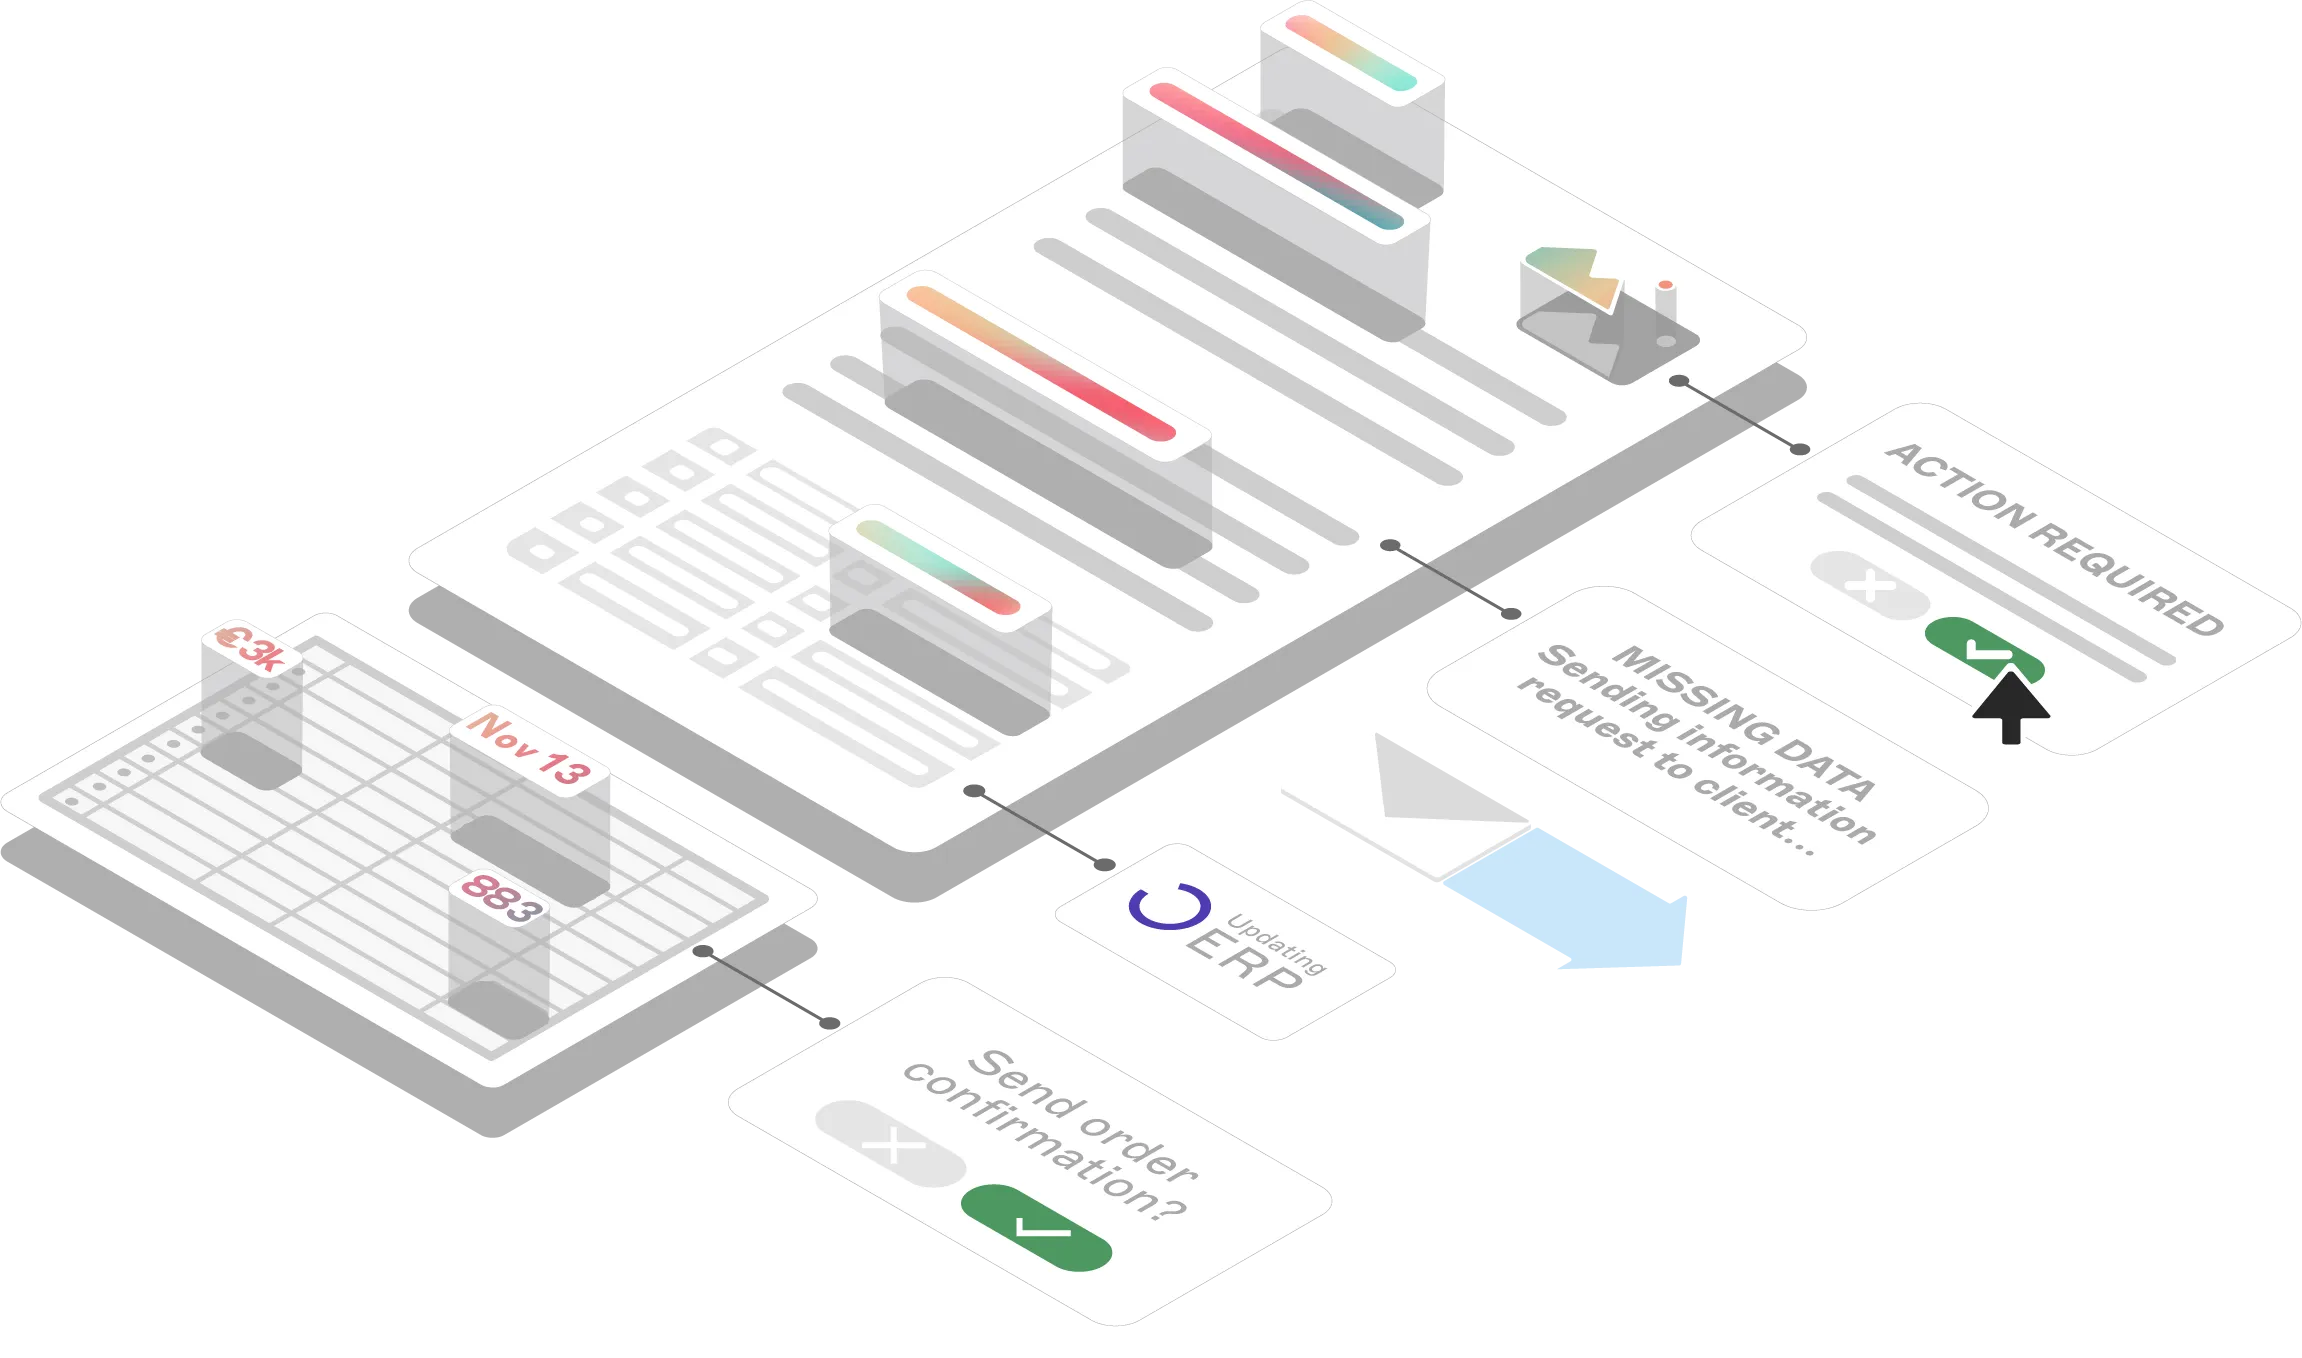
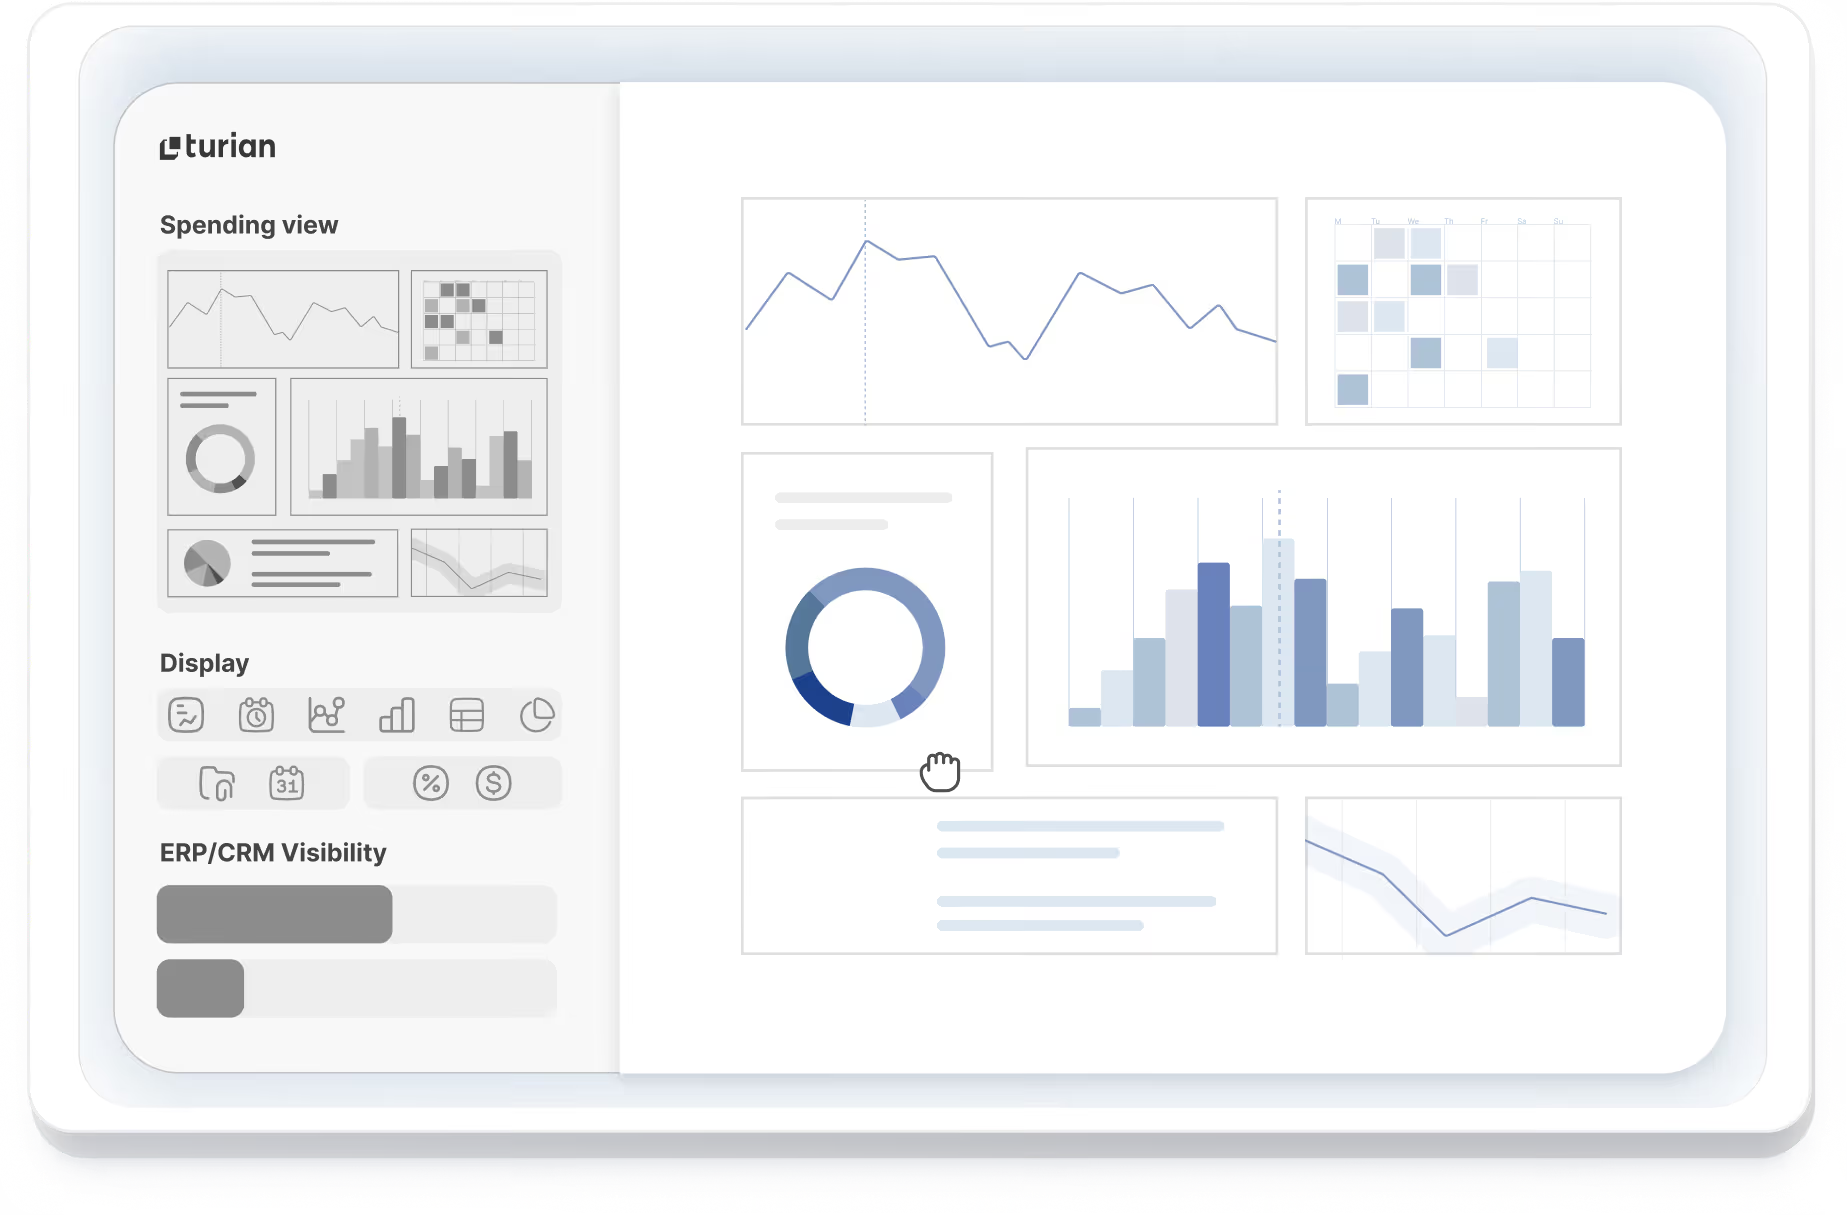
The supplier dashboard provides you with detailed insights into which suppliers frequently confirm with schedule adjustments, change prices, or add additional costs. You can also see at a glance which supplier orders require a particularly high level of manual effort—a good starting point for maintaining your own master data or enriching your next supplier meeting!
Order Confirmation Dashboard
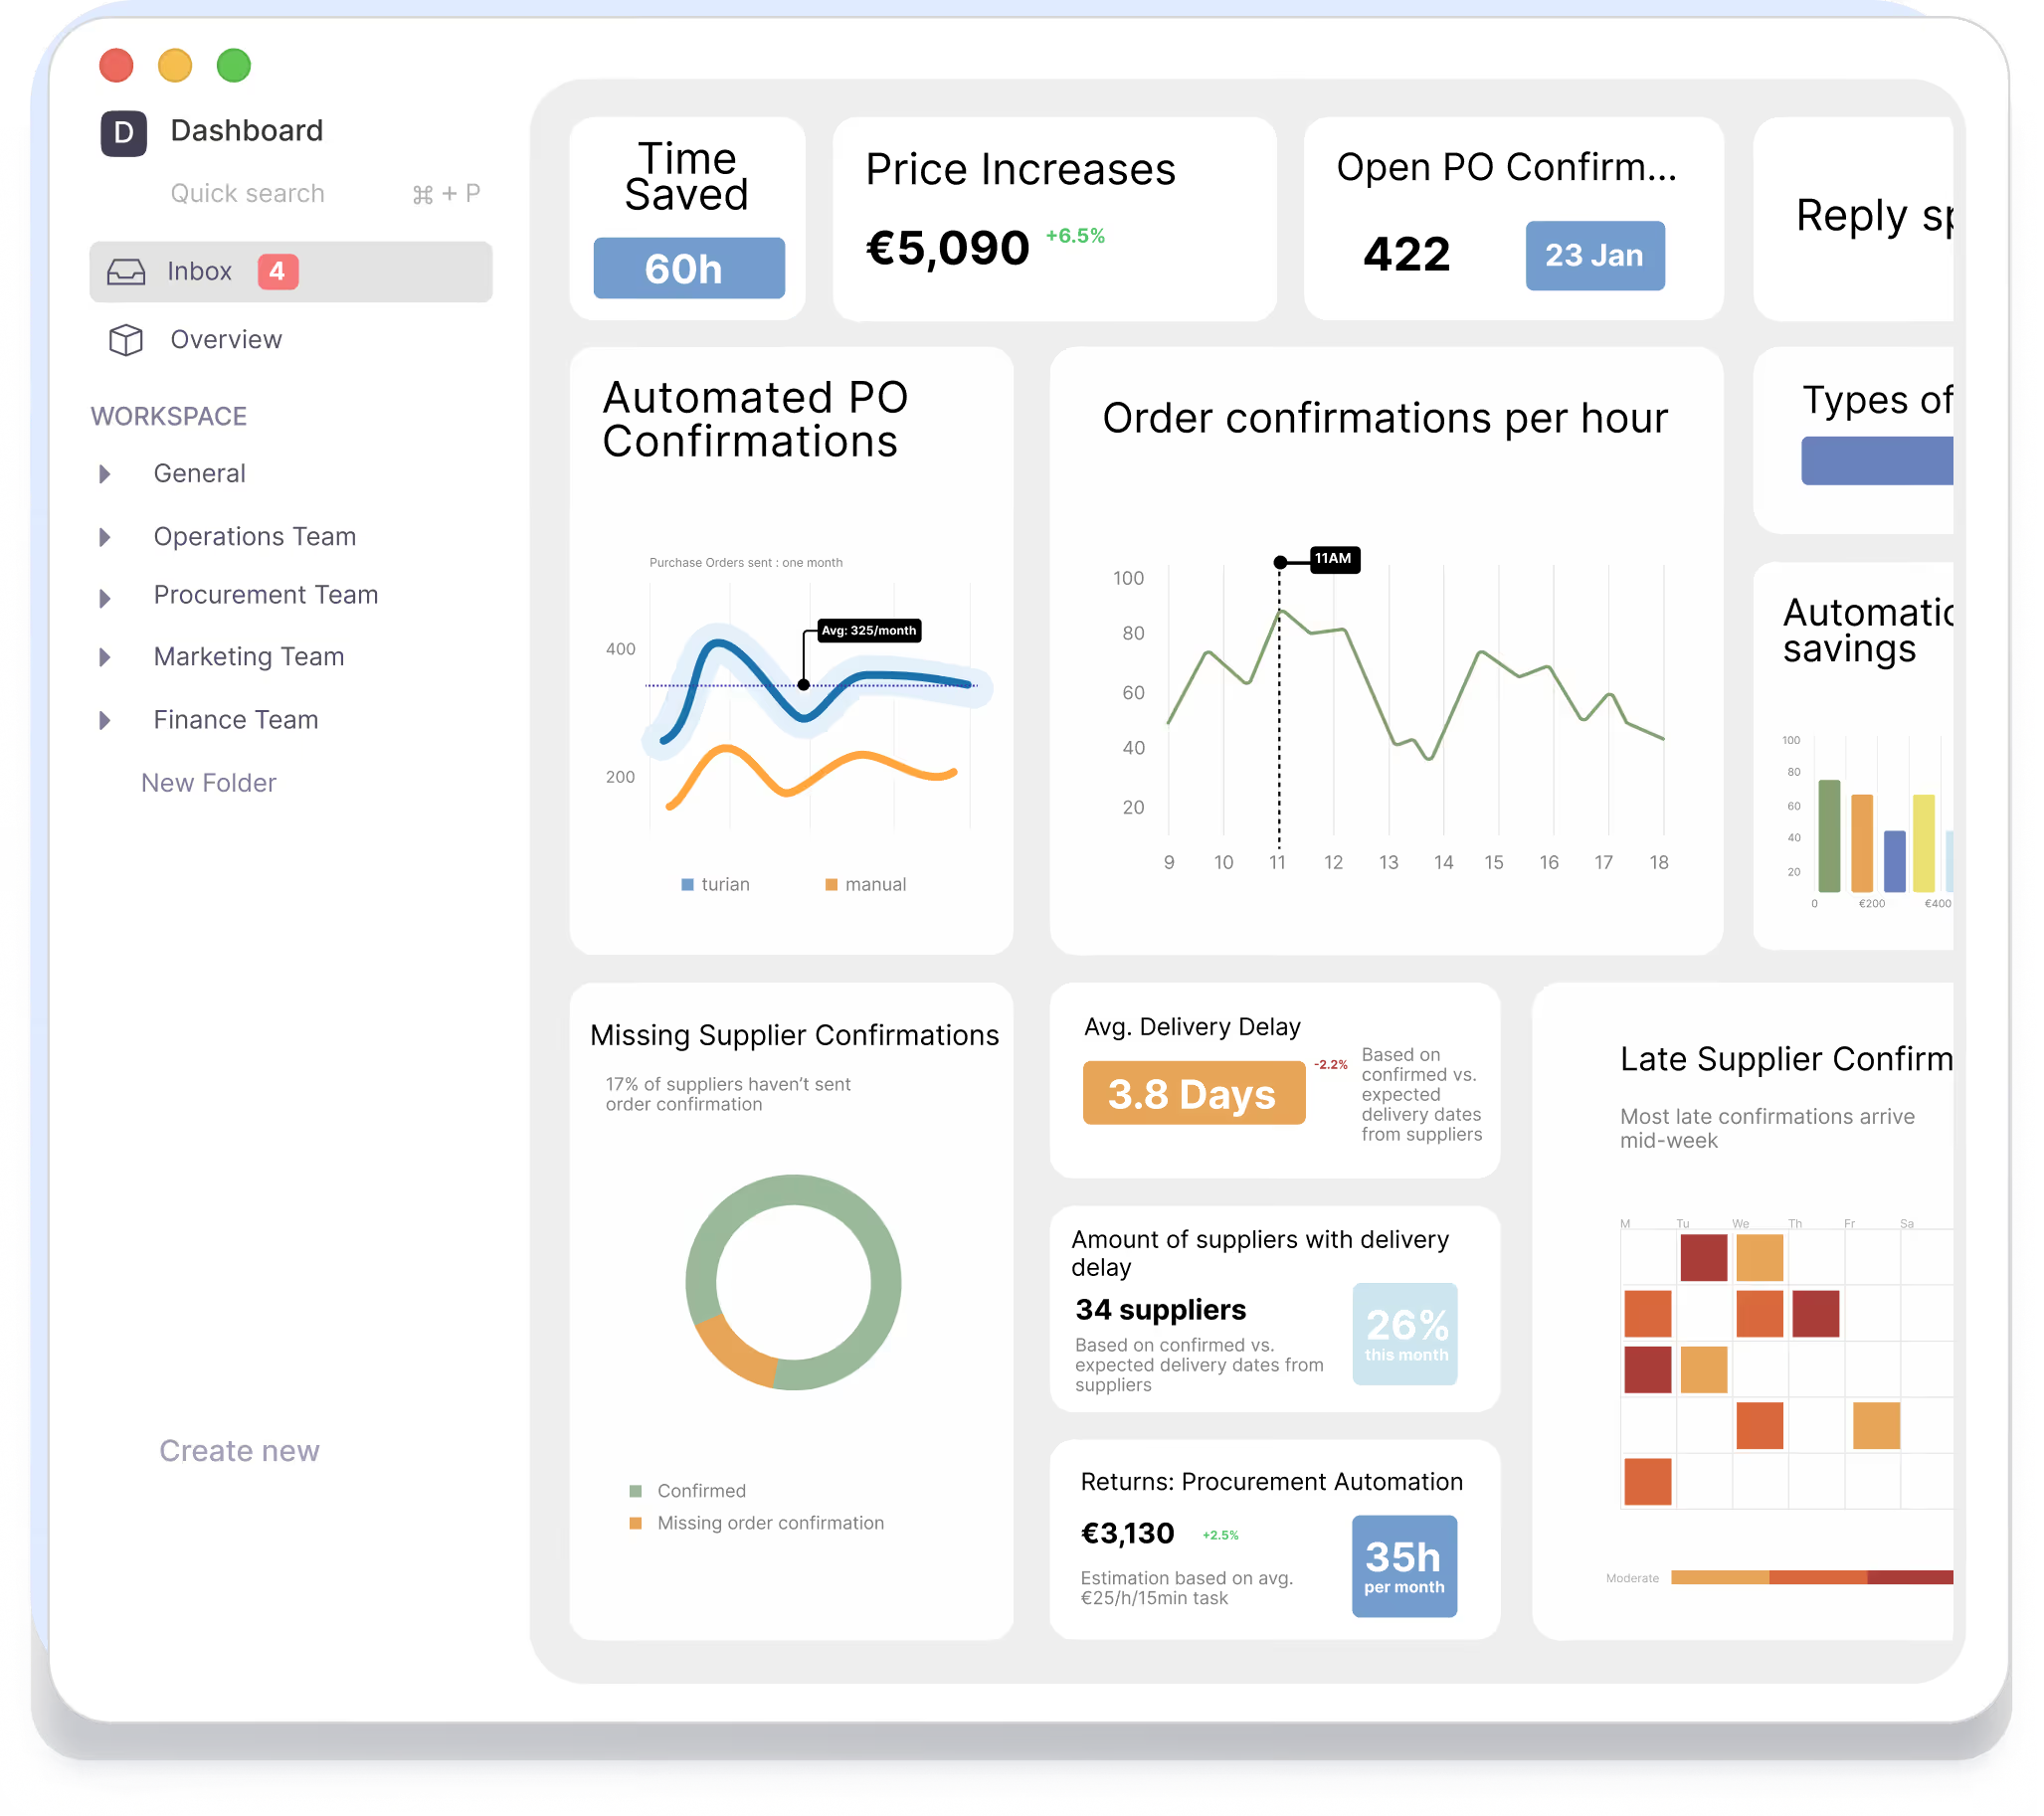
The turian Workspace provides you with an order confirmation dashboard, where you can view the status of all unconfirmed or partially confirmed orders at any time.
The Workspace also allows you to adjust processing tolerances, reminder levels, full automation preferences, and many other settings for the AI agent.
AI-Agent Dashboard
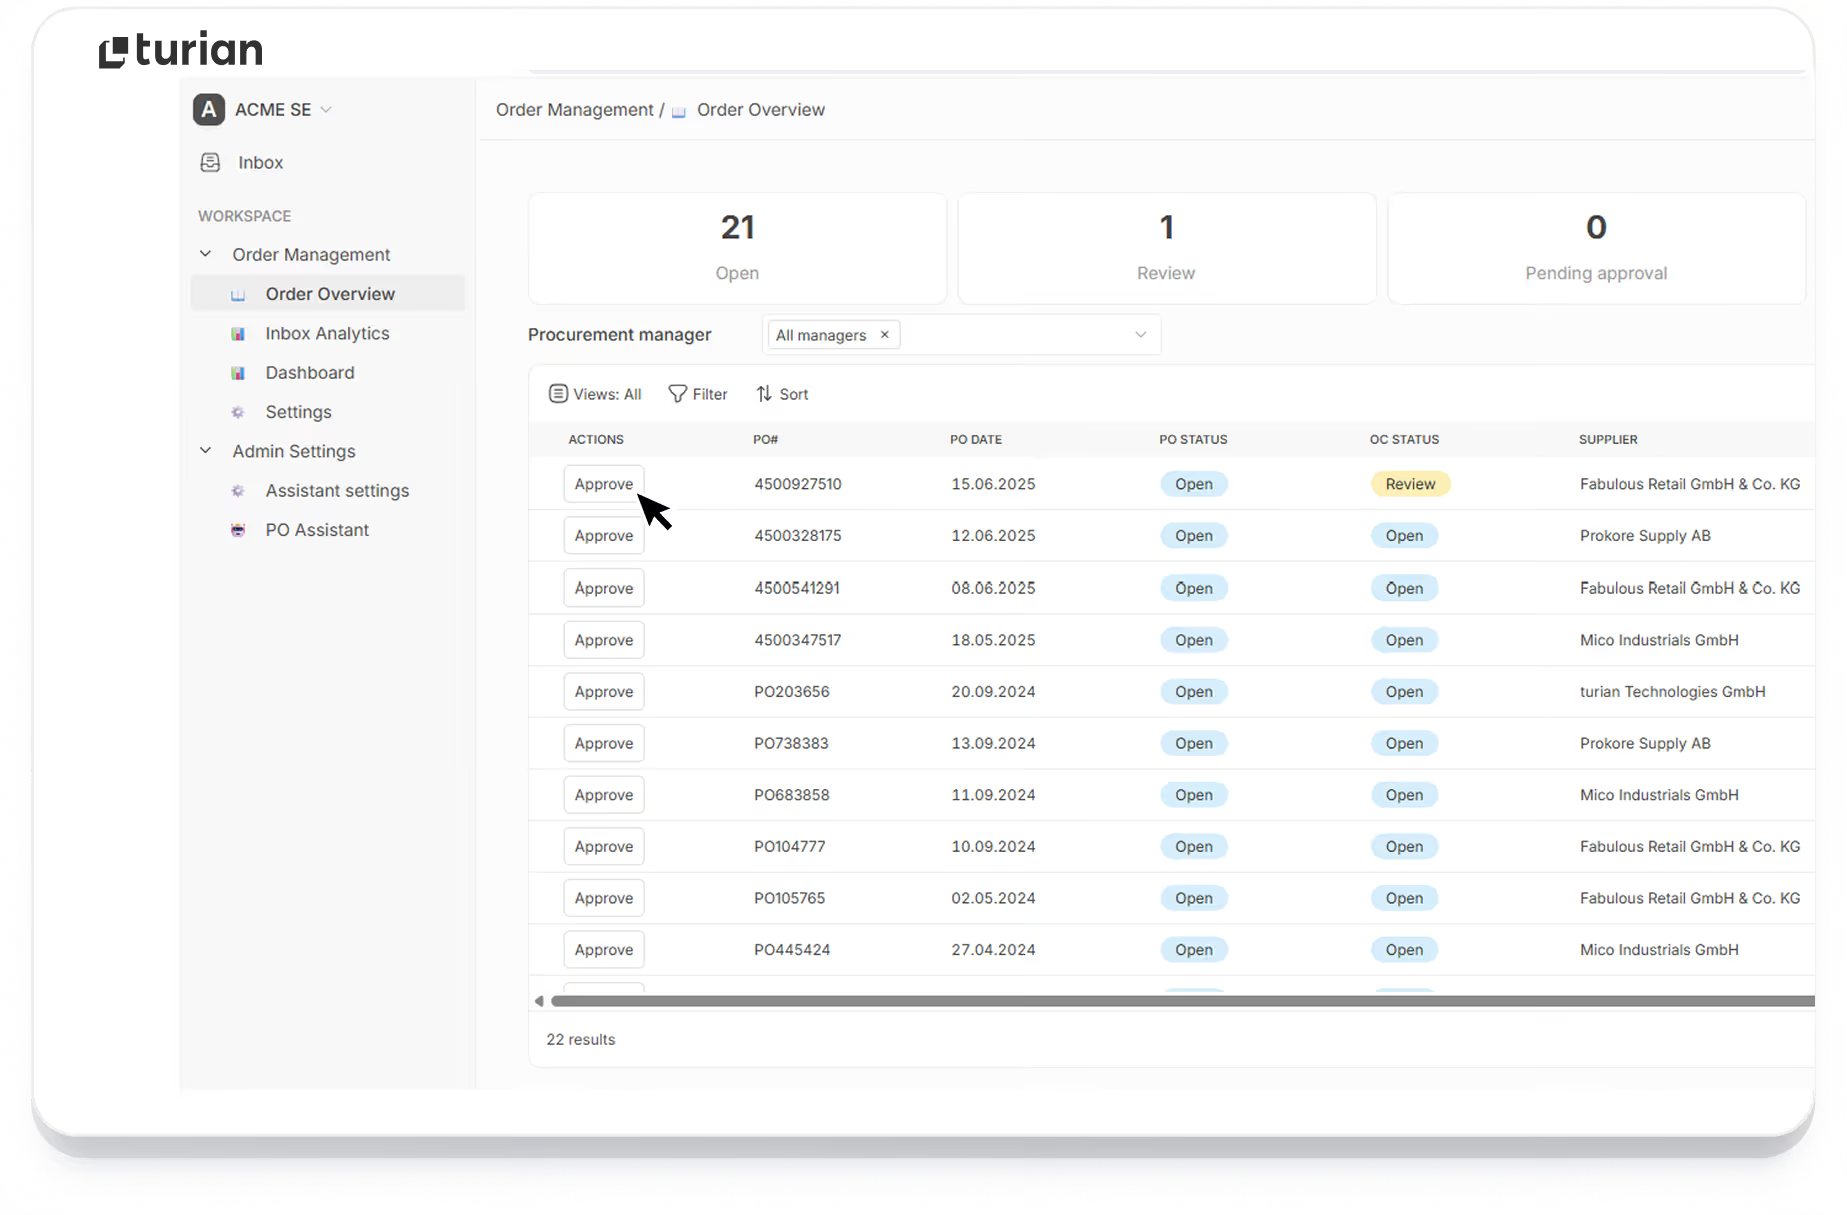
The AI Agent Dashboard gives you a constant overview of how accurately the AI agent is working and how often we need to intervene to correct your users.
In addition, you can track which situations were problematic and which corrections were made.
Seamless integration into existing system landscape
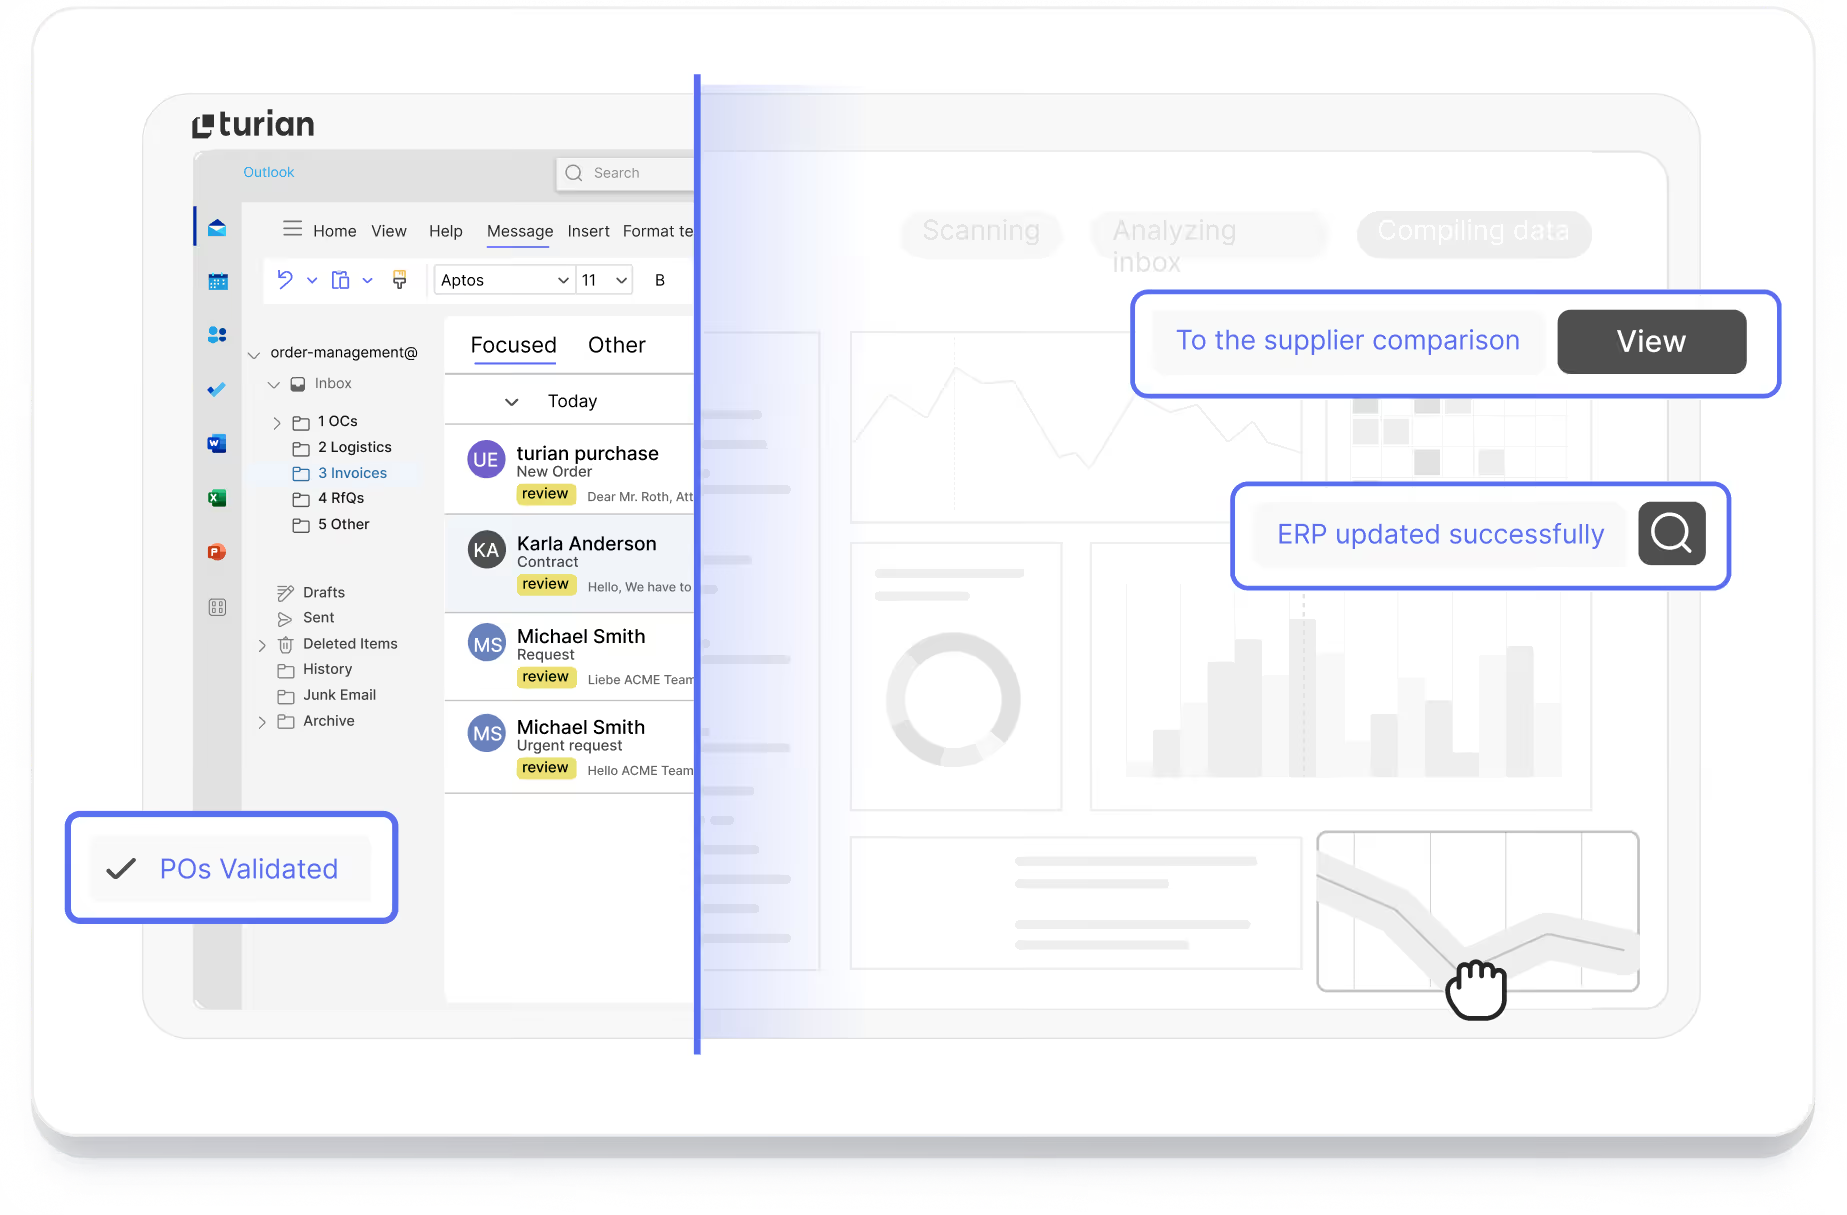
The flexible interface architecture of the turian platform enables seamless connection to a wide range of ERP, DMS, and PIM systems. Extensive standard interfaces are available for leading ERP systems such as SAP and Microsoft Dynamics/Navision.
Quick implementation, no lengthy training
Unlike outdated OCR-based solutions, turian relies exclusively on the latest generative AI models. Even complex documents are processed reliably without model training.
The effective implementation time is just a few days, and the solution covers your entire supplier portfolio right from the start.

Say hi to your
AI Assistant!
Frequently Asked Questions

turian's dashboard shows the key performance indicators for order automation in real time: automation rate (the percentage of incoming orders processed without human intervention), customer recognition rate (how often the system correctly identifies the customer from the incoming document), product recognition rate (how often line items are matched to the correct internal SKU), exception rate (the percentage of orders requiring human review), and total processing volume. These metrics allow operations managers to monitor system performance and identify whether specific order types or customer segments are generating disproportionate exceptions.
Customer recognition rate measures how often turian correctly identifies which ERP customer account corresponds to the sender of an incoming order. Product recognition rate measures how often turian correctly matches a line item in the incoming order to the correct internal SKU. The two can diverge: a high customer recognition rate with a lower product recognition rate indicates customers are being identified reliably but product descriptions are frequently not matching catalog entries, which typically points to gaps in the cross-reference table or catalog data quality.
Exceptions logged in turian's dashboard include the type of exception (unmatched product, price deviation, unknown customer, ambiguous specification) and the frequency with which each type occurs. Recurring exception patterns — for example, a specific customer's product codes consistently generating unmatched items — can be resolved by updating the cross-reference table or adjusting the matching configuration. The dashboard makes these patterns visible so the team can improve system performance over time rather than treating exceptions as one-off manual tasks.
turian's performance data can be accessed for reporting and export. For teams that use BI tools or internal dashboards, the KPI data provides a source for tracking automation performance alongside other operational metrics. Confirm current export and integration options with turian's team for your specific setup.
Automation rate — the percentage of incoming orders processed end-to-end without human intervention — varies by order mix, customer base, and catalog data quality. Orders from known customers for standard, catalogued products with complete information typically reach high automation rates. Orders with customer-specific article numbers not yet in the cross-reference table, specifications outside standard catalog parameters, or missing customer information generate exceptions that require human handling. Automation rate improves over time as the cross-reference table grows and exception patterns are resolved through configuration updates.